PERIODIC TABLES: COLORED and COLOR CODED
with ION INFORMATION and Metals vs Non-metals
Contents Please print in landscape mode for best results.
Please note this site is also available as a
downloadable PowerPoint presentation at:
http://murov.info/pertabtrends.pptx
For many other periodic table trends, please
visit:
https://periodictable.com/Properties/A/CrustAbundance.html
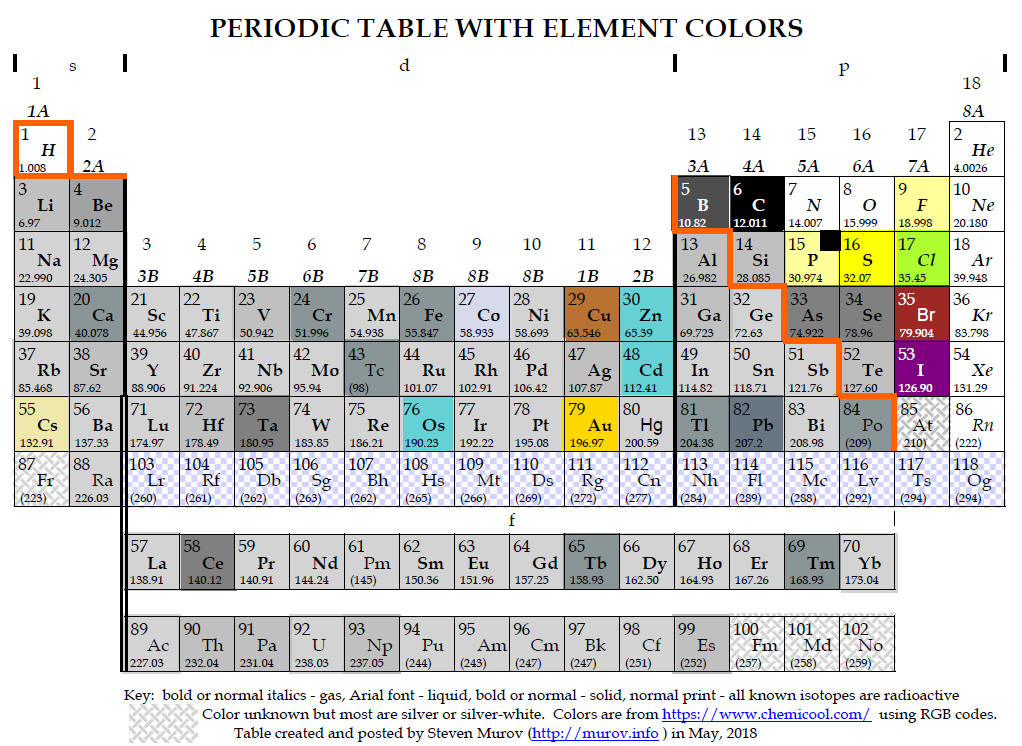
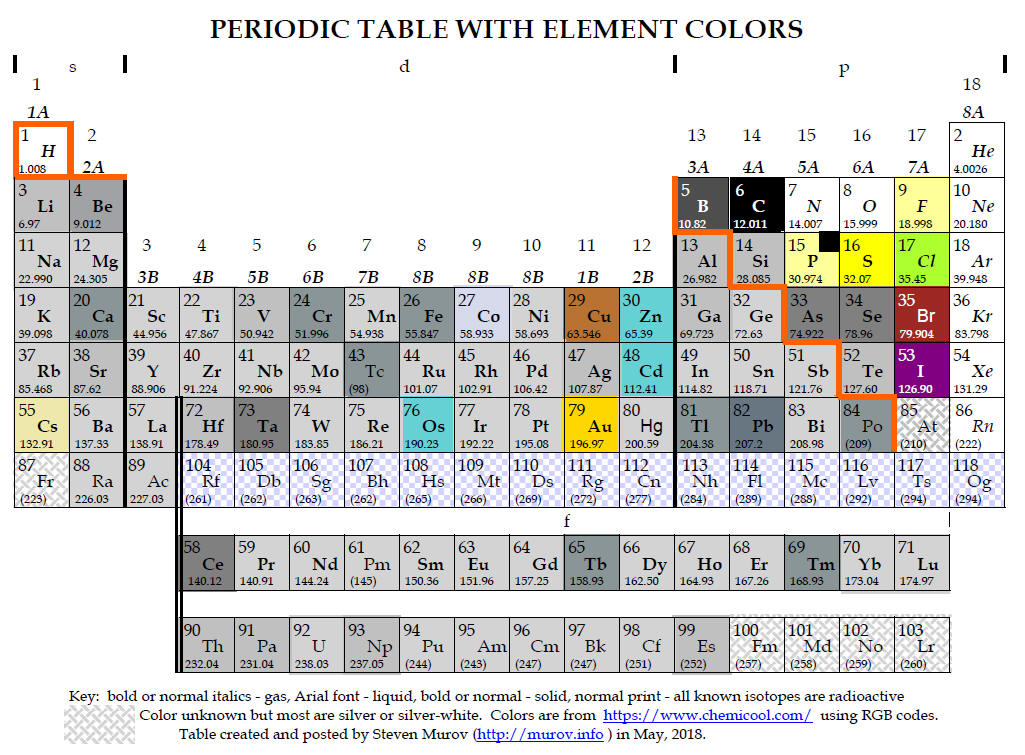
A1, A2. Periodic Tables with Element Colors
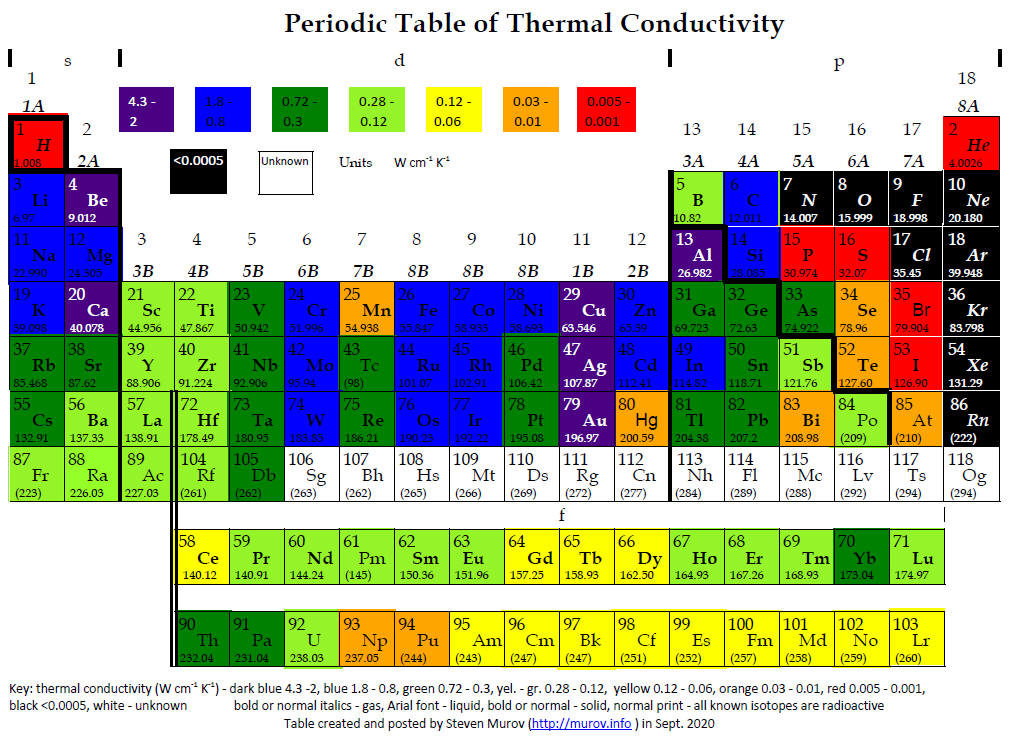
B. Periodic Table with Color Coded Thermal Conductivity
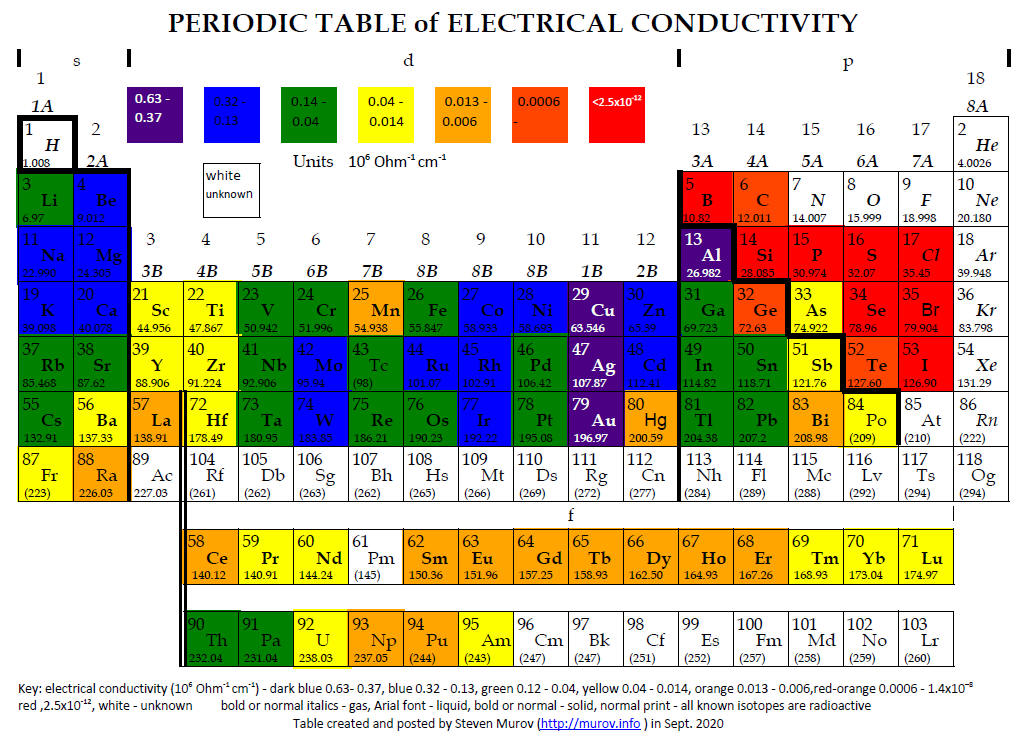
C. Periodic Table with Color Coded Electrical Conductivity
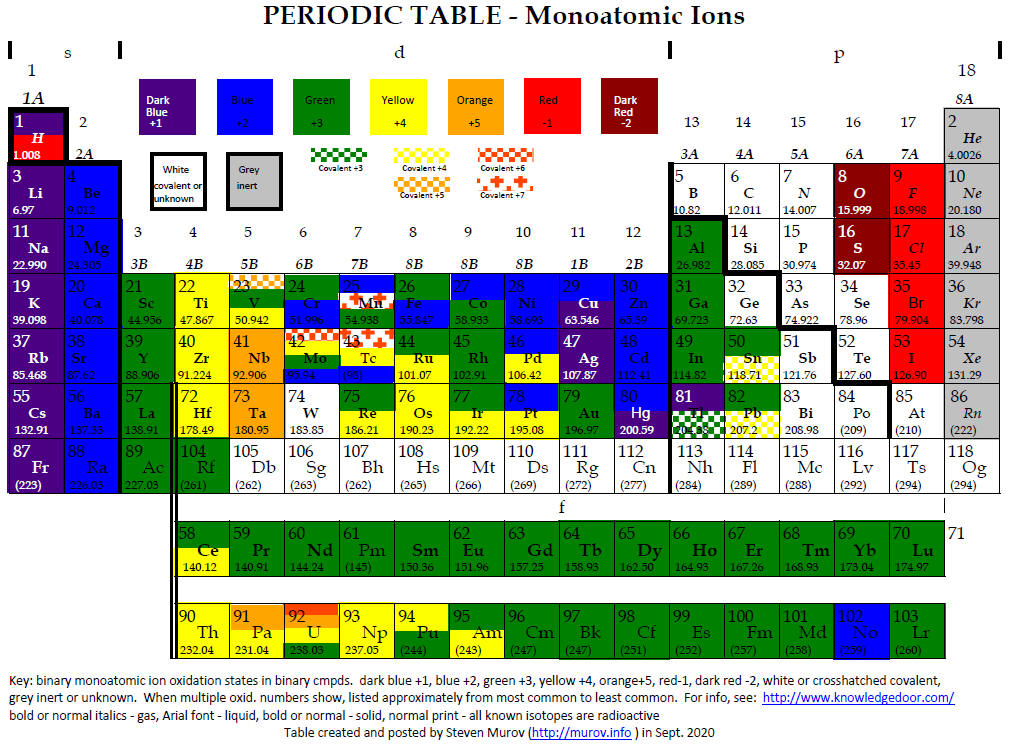
D. Periodic Table with Color Coded Oxidation States of Monoatomic Ions
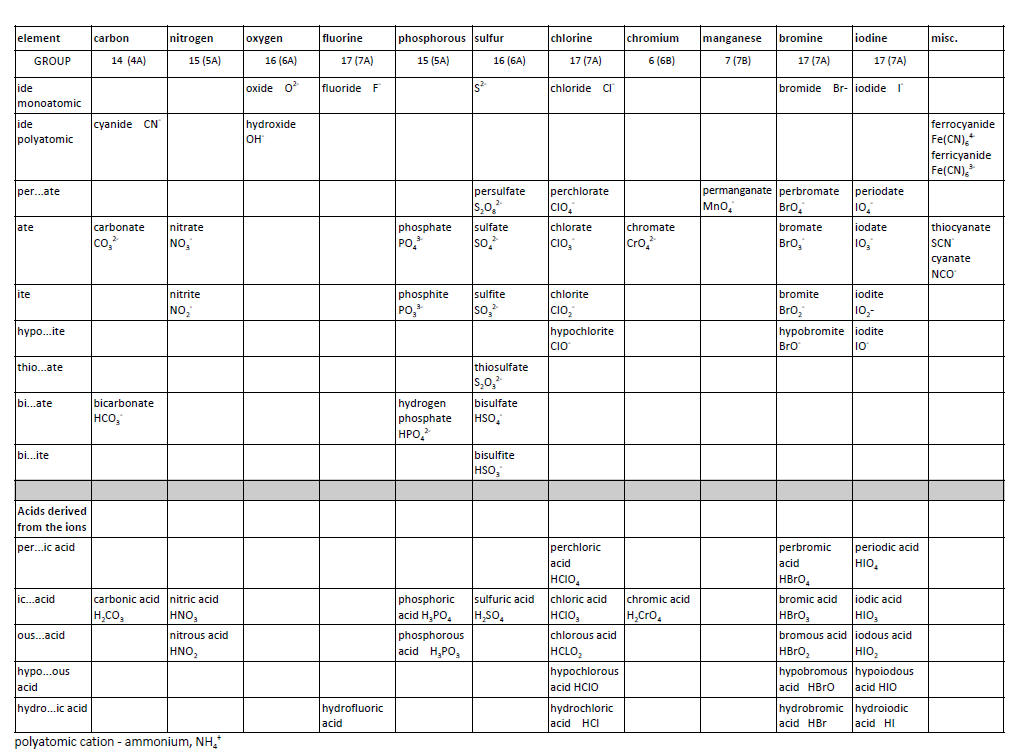
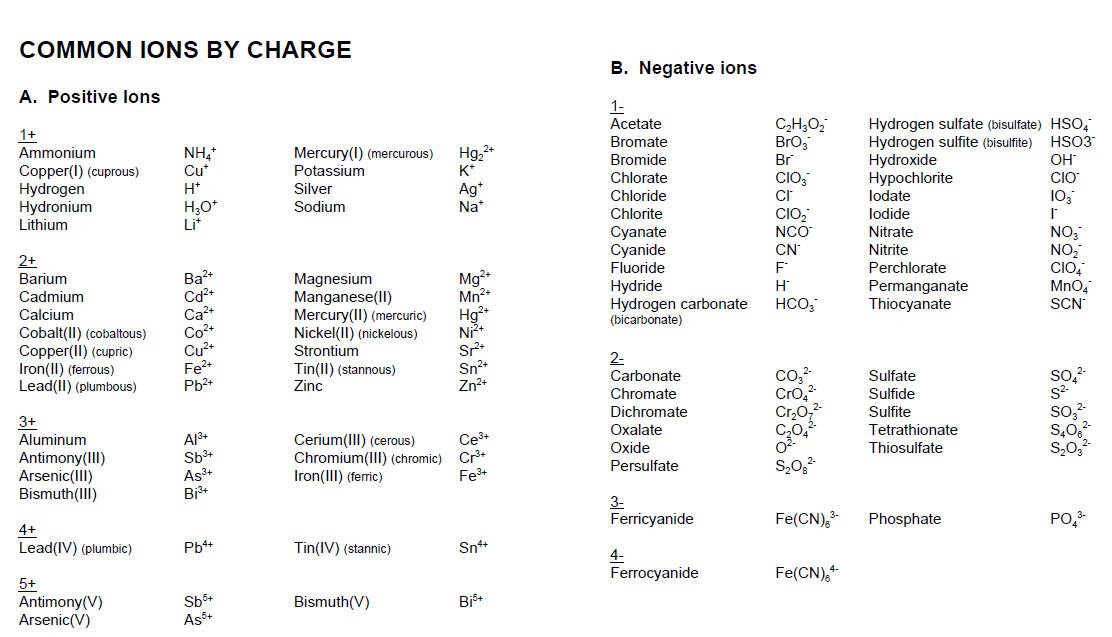
E. Charts of Monoatomic, Oxoanions and Polyatomic Ions
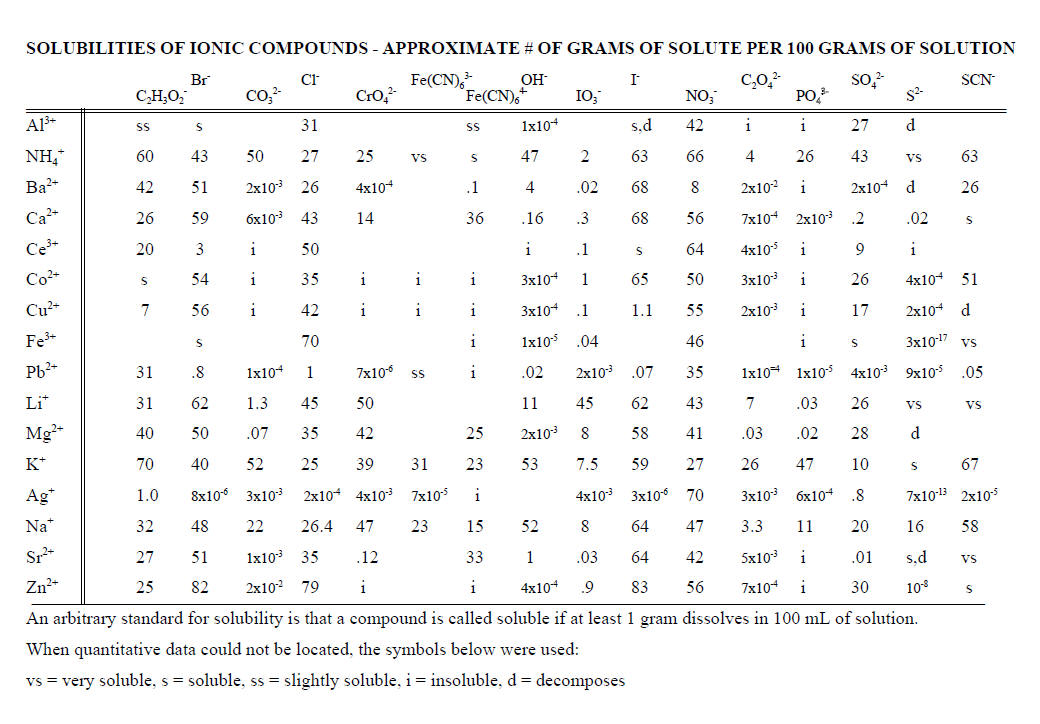
E3. Solubilities of Inorganic Compounds
The periodic tables included above have been selected partially to provide a visual image of some trends in the periodic table. In particular, inspection of the tables give a better idea of the differences between metals and non-metals. Many tables including those above have an artificial staircase that is intended to provide the dividing line between metals and non-metals. The charts do demonstrate some trends but more of a gradual one than a sharp one with many elements that seem to be inconsistent with the staircase. For other periodic tables including many with periodic tables designed to illustrate periodic trends, please visit: http://murov.info/periodictables.htm . For many other chemistry related sites, please visit: http://murov.info/ .
 hit counter started on 9/11/20
>visits
hit counter started on 9/11/20
>visits